Multiple Choice
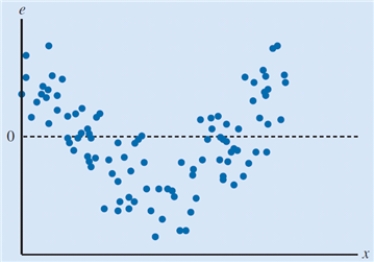
The scatter chart below displays the residuals versus the dependent variable, x. Which of the following conclusions can be drawn based upon this scatter chart? 
A) The residuals have a constant variance.
B) The model fails to capture the relationship between the variables accurately.
C) The model overpredicts the value of the dependent variable for small values and large values of the independent variable.
D) The residuals are normally distributed.
Correct Answer:

Verified
Correct Answer:
Verified
Q10: Regression analysis involving one dependent variable and
Q11: The process of making a conjecture about
Q12: In a linear regression model, the variable
Q13: A variable used to model the effect
Q14: _ refers to the scenario in which
Q16: The scatter chart below displays the residuals
Q17: When the mean value of the dependent
Q18: A _ is used to visualize sample
Q19: In a simple linear regression model, y
Q20: The prespecified value of the independent variable