Multiple Choice
A time series plot of a period of time (in years) versus sales (in thousands of dollars) is shown below. Which of the following data patterns best describes the scenario shown? 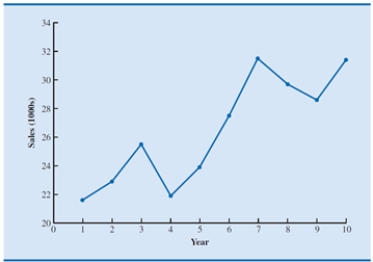
A) Linear trend pattern
B) Nonlinear trend pattern
C) Seasonal pattern
D) Cyclical pattern
Correct Answer:

Verified
Correct Answer:
Verified
Q11: With reference to time series data patterns,
Q12: The value of an independent variable from
Q13: Which is not true regarding trend patterns?<br>A)Can
Q14: Which of the following is true of
Q15: What is the difference between a stationary
Q17: What is the difference between moving averages
Q18: If the forecasted value of the time
Q19: Forecast error<br>A)takes a positive value when the
Q20: If a time series plot exhibits a
Q21: Which of the following statements is the