Multiple Choice
Which of the following inferences about a variable of interest can be drawn from the graph given below? 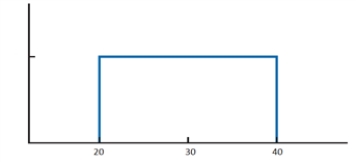
A) The variable is equally likely to take any value between 20 and 40.
B) The variable is more likely to take the value 20 than 40.
C) The variable is more likely to take any value outside the range of 20 and 40.
D) The variable can only take the value 30.
Correct Answer:

Verified
Correct Answer:
Verified
Q8: Which of the following Excel functions would
Q9: A set of values for the random
Q10: The Excel function _ generates integer values
Q11: The profit realized by the sales of
Q12: Which of the following is a disadvantage
Q14: The random variables corresponding to the interarrival
Q15: The weekly demand for an item in
Q16: A store is offering a discount
Q17: Which of the following is true of
Q18: A _ analysis involves considering alternative values