Essay
In its 2000 report, a company presented the following data regarding its sales (in millions of dollars), and net income (in millions of dollars). The bar chart below was used to present these data. 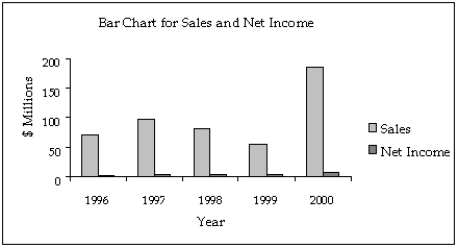 Assume that you are an unscrupulous statistician and want to make the data appear more positive than they really are. Redraw the graph by being selective about which years to include, getting the desired effect.
Correct Answer:

Verified
An unscrupulous statistician could choos...View Answer
Unlock this answer now
Get Access to more Verified Answers free of charge
Correct Answer:
Verified
View Answer
Unlock this answer now
Get Access to more Verified Answers free of charge
Q48: The number of hours a college student
Q52: Slopes and trends in a line chart
Q66: In a perfectly symmetric distribution,which of the
Q76: The mean of fifty sales receipts is
Q80: Graphical excellence is nearly always univariate.
Q113: Strip Mall Rent Monthly rent data
Q137: NARRBEGIN: Weights of Workers<br>Weights of Workers<br>The
Q164: The coefficient of correlation and the least
Q179: Box plots and medians work well to
Q207: The smaller the spread of scores around