Essay
NARRBEGIN: Home Care
Home Care
Data are collected on the number of house calls (x) made in a given week by each of 60 nurses in a certain hospital. The same data set is displayed in each of the three histograms below. 

 NARREND
-Below are two line charts where the percentage return for a stock is shown over time. The two graphs are made from the same data set. 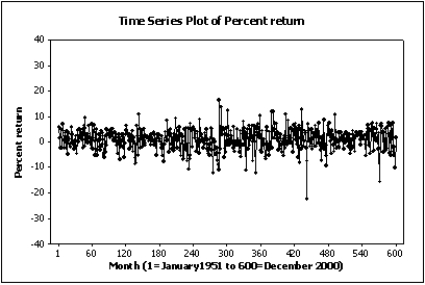
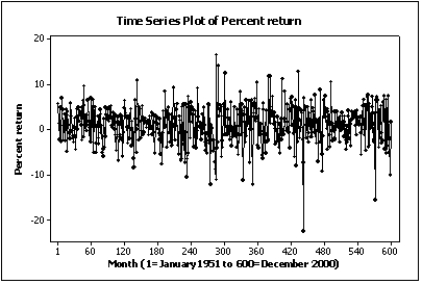 Explain why these two line charts look different.
Correct Answer:

Verified
Their scales on the Y-axis are...View Answer
Unlock this answer now
Get Access to more Verified Answers free of charge
Correct Answer:
Verified
View Answer
Unlock this answer now
Get Access to more Verified Answers free of charge
Q45: According to the Empirical Rule,if the data
Q47: Another word for the mean of a
Q64: A line chart showing the number of
Q97: Home Care Data are collected on
Q104: Ages of Jockeys The following
Q151: The median of a set of data
Q161: The range is considered the weakest measure
Q234: Yearly Donations<br> The following data
Q250: We can frequently make several inferences about
Q256: Hours of Playing Video Games