Multiple Choice
NARRBEGIN: Home Care
Home Care
Data are collected on the number of house calls (x) made in a given week by each of 60 nurses in a certain hospital. The same data set is displayed in each of the three histograms below. 

 NARREND
-Which of the following statements describe(s) the line chart below? 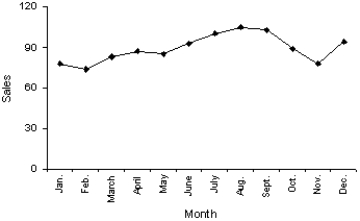
A) November experienced the lowest sales throughout the year.
B) August experienced the highest sales throughout the year.
C) Sales did not fluctuate more than 30 units on either side of 90.
D) All of these choices are true.
Correct Answer:

Verified
Correct Answer:
Verified
Q4: What does the length of each line
Q11: NARRBEGIN: Home Care<br>Home Care<br>Data are collected on
Q15: Which of the following describes a positive
Q16: NARRBEGIN: Electronics Company<br>Electronics Company<br>At a meeting
Q18: NARRBEGIN: Home Care<br>Home Care<br>Data are collected
Q64: A cumulative relative frequency distribution lists the
Q75: The relationship between two interval variables is
Q131: Insurance Company A representative from a local
Q143: Observations that are measured at successive points
Q148: A stem-and-leaf display represents nominal data.