Multiple Choice
The number (in millions) of women in the work force, given as a function f, of the year for selected years from 1920 to 2000, is shown in the figure below. Estimate  and explain its meaning.
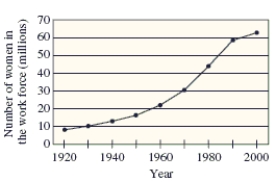
Source: 2004 World Almanac
A) 
: The number of women in the work force increased by 10,000,000.
B) 
: The number of women in the work force decreased by 2,000,000.
C) 
: The number of women in the work force did not increase.
D) 
: The number of women in the work force increased by 2,000,000.
E) 
: The number of women in the work force decreased by 10,000,000
Correct Answer:

Verified
Correct Answer:
Verified
Q167: Write the equation of the line passing
Q168: Graph the function using a window that
Q169: The percent of the U.S. population with
Q170: One safe investment pays 10% per year,
Q171: For <img src="https://d2lvgg3v3hfg70.cloudfront.net/TB1243/.jpg" alt="For and
Q173: In seawater, the pressure p is related
Q174: Graph the equation with a standard window
Q175: If <img src="https://d2lvgg3v3hfg70.cloudfront.net/TB1243/.jpg" alt="If is
Q176: Is the relation defined by the table
Q177: A manufacturer of shower-surrounds has a revenue