Multiple Choice
Choose the graph that represents the equation below.

A) 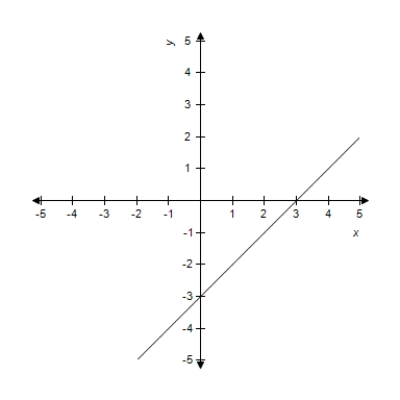
B) 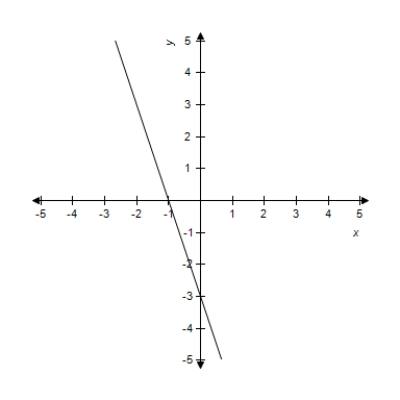
C) 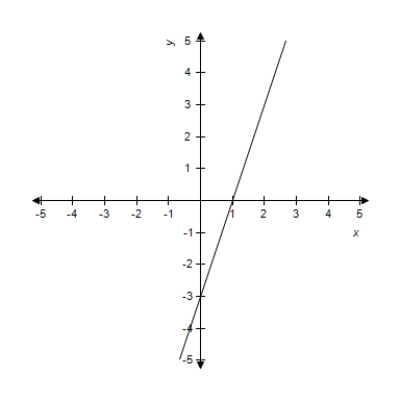
D) 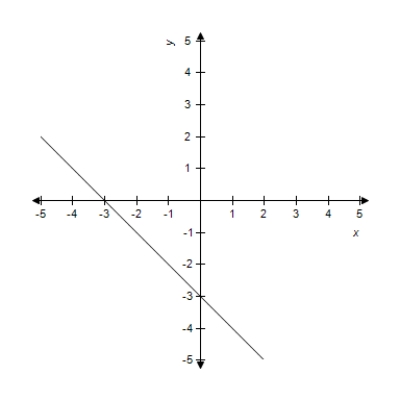
E) 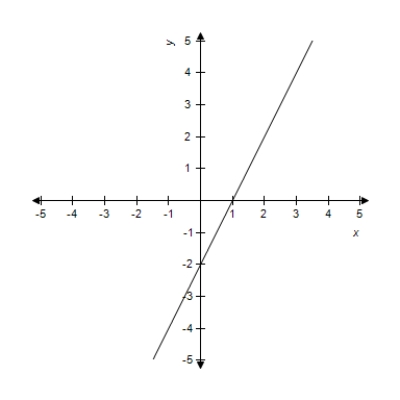
Correct Answer:

Verified
Correct Answer:
Verified
Related Questions
Q86: Suppose that a certain product has the
Q87: The figure below show the demand and
Q88: Using a graphing utility or Excel to
Q89: Graph the equation with a graphing utility
Q90: Let <img src="https://d2lvgg3v3hfg70.cloudfront.net/TB1243/.jpg" alt="Let and
Q92: Solve the system by elimination, or by
Q93: In the United States between 1970 and
Q94: Determine whether the following pairs of equations
Q95: The equation in this problem leads to
Q96: Suppose <img src="https://d2lvgg3v3hfg70.cloudfront.net/TB1243/.jpg" alt="Suppose in