Multiple Choice
Suppose the percent of U.S. high school seniors from 1975 to 2001 who used marijuana can be modeled by 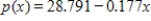 , where x is the number of years past 1975. What is the slope of the graph of this function?
A) - 0.288
B) 0.177
C) - 2.879
D) - 0.177
E) 28.791
Correct Answer:

Verified
Correct Answer:
Verified
Q46: The combination of cold temperatures and wind
Q47: Use a graphing utility with the standard
Q48: A small business recaps and sells tires.
Q49: Let <img src="https://d2lvgg3v3hfg70.cloudfront.net/TB1243/.jpg" alt="Let and
Q50: Choose the graph that represents the equation
Q52: A $680,000 property is depreciated for tax
Q53: If <img src="https://d2lvgg3v3hfg70.cloudfront.net/TB1243/.jpg" alt="If ,
Q54: Find the slope m and y-intercept b
Q55: For <img src="https://d2lvgg3v3hfg70.cloudfront.net/TB1243/.jpg" alt="For and
Q56: A linear cost function is <img src="https://d2lvgg3v3hfg70.cloudfront.net/TB1243/.jpg"