Multiple Choice
With U.S. Census Bureau data, the model that relates the per capita annual income (in thousands of dollars) of blacks B and whites W was found to be 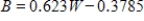 . Use a graphing utility to graph this equation for the range
  ,
,  ;
;  ,
,  . Is the image below the correct graph of the function?
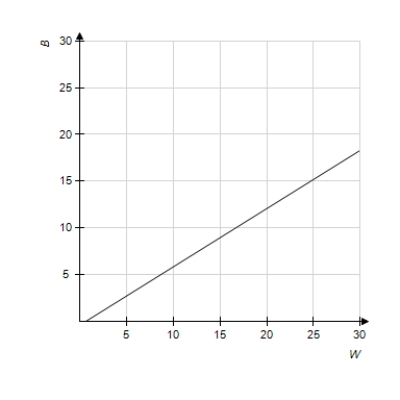
A) yes
B) no
Correct Answer:

Verified
Correct Answer:
Verified
Q199: Suppose that the total cost function for
Q200: The equation in this problem leads to
Q201: The equation in this problem leads to
Q202: It has been estimated that a certain
Q203: Using data from the Internal Revenue Service,
Q205: Solve the inequality. <img src="https://d2lvgg3v3hfg70.cloudfront.net/TB1243/.jpg" alt="Solve
Q206: Write the equation and graph the line
Q207: Find the slope m and y-intercept b
Q208: Solve for <img src="https://d2lvgg3v3hfg70.cloudfront.net/TB1243/.jpg" alt="Solve for
Q209: A function and its graph are given.