Multiple Choice
The number (in millions) of U.S. cellular telephone subscribers can be described by 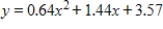 , where x is the number of years past 1990. For years beyond 2010, does this graph increase or decrease? (Look at this graph in a window that includes these years.)
A) increases
B) decreases
Correct Answer:

Verified
Correct Answer:
Verified
Related Questions
Q57: If the demand and supply functions for
Q58: Assume that the price for a pair
Q59: In wildlife management, the capture-mark-recapture technique is
Q60: Find the domain and range of the
Q61: Write the equation for line that passes
Q63: The percent p of high school seniors
Q64: Solve the system by elimination, or by
Q65: A shipping crate has a square base
Q66: Suppose a professor counts the final exam
Q67: If a box with a square cross