Multiple Choice
The figure below is the graph of both the demand function D and the supply function S for the same product, where P is the price per unit and Q is the number of units produced. Will there be a market surplus or shortage when the price P is $250? 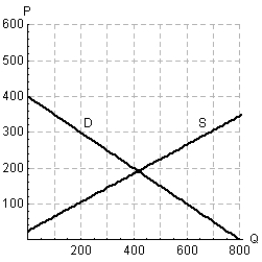
A) There will be a market shortage.
B) There will be a market surplus.
Correct Answer:

Verified
Correct Answer:
Verified
Q17: Suppose <img src="https://d2lvgg3v3hfg70.cloudfront.net/TB1243/.jpg" alt="Suppose in
Q18: A social agency is charged with providing
Q19: A glass of skim milk supplies 0.1
Q20: Graph the equation with a graphing utility
Q21: Solve the system by elimination, or by
Q23: Suppose a mining company will supply 80,000
Q24: For the given graph, determine whether the
Q25: Determine whether the following pairs of equations
Q26: When a debt is refinanced, sometimes the
Q27: Solve the system by elimination, or by