Multiple Choice
The figure below is the graph of the demand function D, the supply function S, and the supply function after a $30 tax T for the same product. Is it possible for the government to earn no money if it keeps increasing taxes on this product? 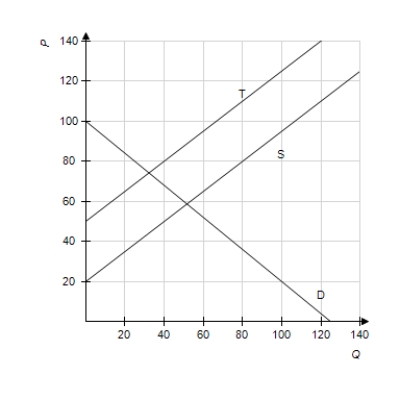
A) Yes
B) No
Correct Answer:

Verified
Correct Answer:
Verified
Q127: What is the rate of change of
Q128: The equation in this problem leads to
Q129: If <img src="https://d2lvgg3v3hfg70.cloudfront.net/TB1243/.jpg" alt="If ,
Q130: Two models for measuring the effects of
Q131: Solve the equation. <img src="https://d2lvgg3v3hfg70.cloudfront.net/TB1243/.jpg" alt="Solve
Q133: Use the left-to-right elimination method to solve
Q134: Using a graphing utility or Excel to
Q135: Use a graphing utility with the standard
Q136: Use the left-to-right elimination method to solve
Q137: The total price of a new car