Multiple Choice
The amount of money invested in a certain mutual funds, measured in millions of dollars, for the years 1995 to 1999 was found to be modeled by 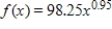 million dollars, where x is the number of years past 1990. Will the graph of this function bend upward or will it bend downward? How much money is predicted to be in the fund in the year 2009? Round your answer to two decimal places.
A) the function's graph bends upward; the function predicts 134,947.08 million dollars in 2009
B) the function's graph bends downward; the function predicts 134,947.08 million dollars in 2009
C) the function's graph bends upward; the function predicts 68,279.14 million dollars in 2009
D) the function's graph bends downward; the function predicts 1,611.20 million dollars in 2009
E) the function's graph bends upward; the function predicts 1,611.20 million dollars in 2009
Correct Answer:

Verified
Correct Answer:
Verified
Q86: Find the vertex and then determine the
Q87: Find the exact real solutions of the
Q88: Solve the equation <img src="https://d2lvgg3v3hfg70.cloudfront.net/TB1243/.jpg" alt="Solve the
Q89: Suppose a company has fixed costs of
Q90: The demand function for a product is
Q92: Suppose that the percent of total personal
Q93: Determine what type of function best models
Q94: Determine whether the scatter plot should be
Q95: The daily profit from the sale of
Q96: Given the profit function, <img src="https://d2lvgg3v3hfg70.cloudfront.net/TB1243/.jpg" alt="Given