Multiple Choice
The table that follows gives the population of a city. Find the power function that best fits the data, with x equal to the number of years past 1950. According to the model, will the city's population be greater than 1,400 by the year 2010? Round your final answer to three decimal places. 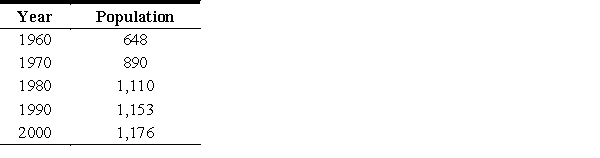
A) 
The model predicts that the population will not be greater than 1,400.
B) 
The model predicts that the population will not be greater than 1,400.
C) 
The model predicts that the population will be greater than 1,400.
D) 
The model predicts that the population will be greater than 1,400.
E) 
The model predicts that the population will not be greater than 1,400.
Correct Answer:

Verified
Correct Answer:
Verified
Q64: Sketch the graph of the following function
Q65: Sketch the graph of the function <img
Q66: Solve the equation by using the quadratic
Q67: Write the equation <img src="https://d2lvgg3v3hfg70.cloudfront.net/TB1243/.jpg" alt="Write the
Q68: The model for body-heat loss depends on
Q70: Assume that sales revenues for Continental Divide
Q71: Factor the function <img src="https://d2lvgg3v3hfg70.cloudfront.net/TB1243/.jpg" alt="Factor the
Q72: The sensitivity S to a drug is
Q73: Assume that costs and expenses for Continental
Q74: Determine whether the scatter plot should be