Multiple Choice
Suppose that the following table shows the number of millions of people in the United States who lived below the poverty level for selected years. Find a cubic model that approximately fits the data, using x as the number of years after 1960. Round numerical values in your answer to four decimal places. Depending on the technology you use, your answer may be slightly different than the correct answer shown. 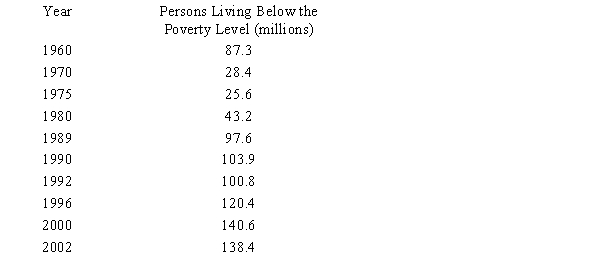
A) 
B) 
C) 
D) 
E) 
Correct Answer:

Verified
Correct Answer:
Verified
Q35: The daily profit from the sale of
Q36: By recognizing shapes and features of polynomial
Q37: Sketch the graph of the function <img
Q38: A supply function has the equation is
Q39: If the supply function for a commodity
Q41: A ball thrown vertically into the air
Q42: The daily profit from the sale of
Q43: Determine whether the given graph is the
Q44: If a firm has the following cost
Q45: Graph the power function that models the