Multiple Choice
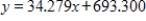
The table below shows the national expenditures for health care in a certain country for selected years. Find a power model and a linear model for the data where x is the number of years after 1950. Which of the models seems to be the best to use if you are interested in finding the health care costs near the year 1990? Round numerical values in your answers to three decimal places. 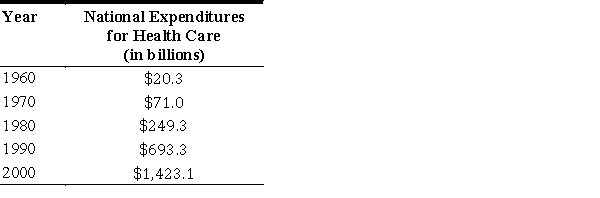
A) 
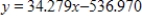
The power model gives more accurate results near the year 1990.
B) 

The linear model gives more accurate results near the year 1990.
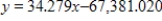
C) 

The power model gives more accurate results near the year 1990.
D) 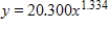
The linear model gives more accurate results near the year 1990.
E) 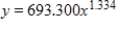
The power model gives more accurate results near the year 1990.
Correct Answer:

Verified
Correct Answer:
Verified
Q3: Suppose that the following table gives the
Q4: Determine whether the vertex of the graph
Q5: Sketch the graph of the function <img
Q6: A fissure in the earth appeared after
Q7: Determine if the vertex of the graph
Q9: Determine whether the given graph is the
Q10: The table shows the average earnings of
Q11: By recognizing shapes and features of polynomial
Q12: The total costs for a company are
Q13: Find the x-intercepts, if any exist. Round