Multiple Choice
Let  . Use a graphing utility to graph the functions
  and
and  where
where  . Identify the graphs of
  and
and  below.
A) 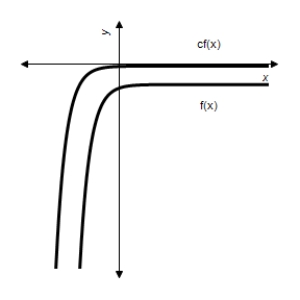
B) 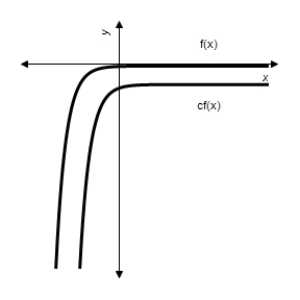
C) 
D) 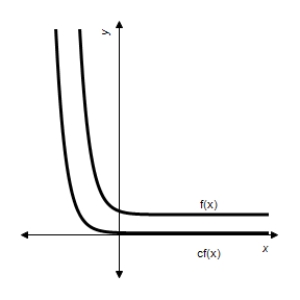
E) 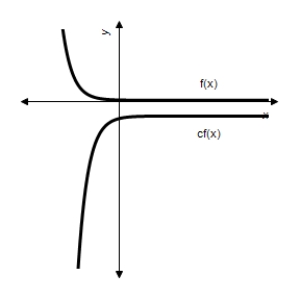
Correct Answer:

Verified
Correct Answer:
Verified
Related Questions
Q38: Use properties of logarithms or a definition
Q39: The following table gives the average number
Q40: Use properties of logarithms or a definition
Q41: If the total cost (in dollars) for
Q42: Write the expression as the sum or
Q44: Use properties of logarithms or a definition
Q45: The following table gives the average number
Q46: Use the following information. Chemists use the
Q47: Let <img src="https://d2lvgg3v3hfg70.cloudfront.net/TB1243/.jpg" alt="Let .
Q48: Between the years 1960 and 2002, the