Multiple Choice
The following figure shows a graph that compares the present values of two ordinary annuities of $800 quarterly as functions of the number of quarters. One annuity is at an annual rate of 6% compounded quarterly, and the other is at an annual rate of 9% compounded quarterly. Use the graph below to estimate the difference between the present values of these annuities for 25 years (100 quarters) . 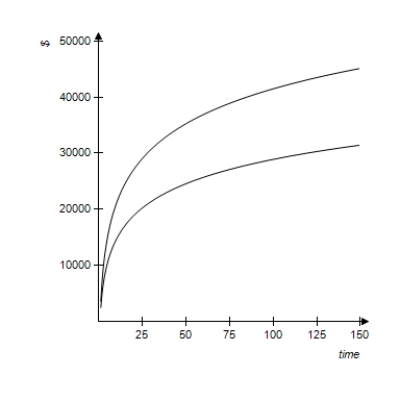
A) $32,000
B) $4,500
C) $30,000
D) $100
E) $9,586
Correct Answer:

Verified
Correct Answer:
Verified
Q27: A sinking fund is established to discharge
Q28: How much is needed in an account
Q29: A debt of $100,000 is amortized at
Q30: A developer wants to buy a certain
Q31: Which of the following expresses the sum
Q33: What is the size of the payments
Q34: Suppose an individual wants to have $190,000
Q35: A property owner has several rental units
Q36: Write an expression that gives the requested
Q37: A new firm loses $1,600 in its