Multiple Choice
The following table gives the average number of voters in each of three political parties during the last 12 years, along with the average number that voted in presidential elections during this period. Use these data to find the probability, rounded to two decimal places, that a person selected at random from the registered Democratic voters will vote in the next election. 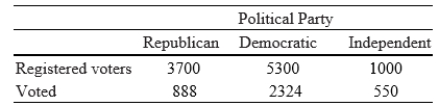
A) Pr(Democratic will vote) = 0.55
B) Pr(Democratic will vote) = 0.44
C) Pr(Democratic will vote) = 0.24
D) Pr(Democratic will vote) = 0.56
E) Pr(Democratic will vote) = 0.45
Correct Answer:

Verified
Correct Answer:
Verified
Q32: An urn contains five red R balls
Q33: A senator asks his constituents to rank
Q34: How many three-digit numbers can be formed
Q35: A car dealer has 7 different cars
Q36: A department store manager wants to display
Q38: A game of cards is played with
Q39: An unprepared student must take a 7-question,
Q40: If the probability that event E will
Q41: A car dealer has 15 different cars
Q42: A computer store offers used computers free