Multiple Choice
Which frequency histogram best describes the data given in the frequency table?
Age
Frequency
1-4
6
5-8
9
9-12
3
13-16
1
17-20
4
A) 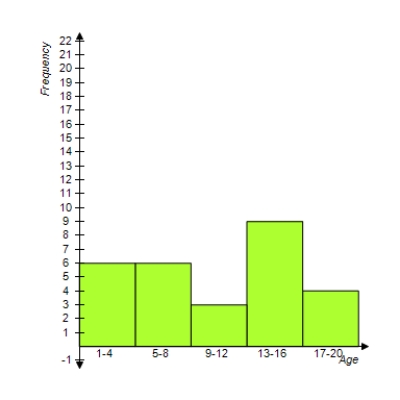
B) 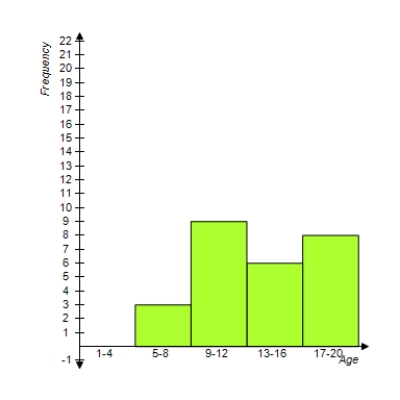
C) 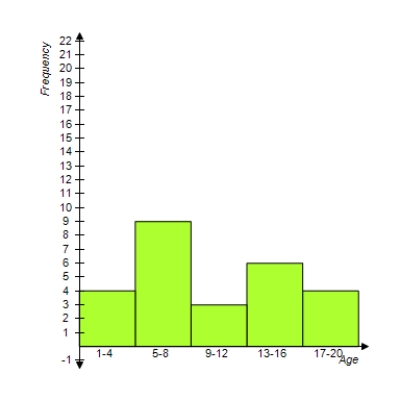
D) 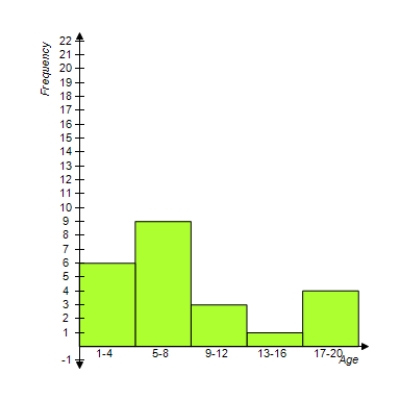
E) 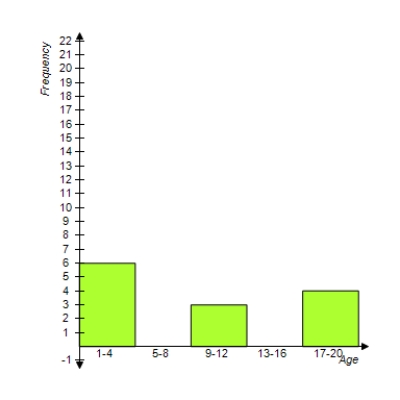
Correct Answer:

Verified
Correct Answer:
Verified
Related Questions
Q10: Systolic blood pressure for a group of
Q11: Determine y, if possible, so that the
Q12: In a certain school district, 23% of
Q13: Determine c, if possible, so that the
Q14: A bag contains 6 red balls and
Q16: In a binomial experiment, find the probability
Q17: A car owner must decide whether she
Q18: Suppose the probability that a certain drug
Q19: A young man plans to sell umbrellas
Q20: Determine c, if possible, so that the