Multiple Choice
The following table gives a city's unemployment rates for civilian workers for selected years from 1960 to 2004. Which bar graph represents the information given in the table? 
A) 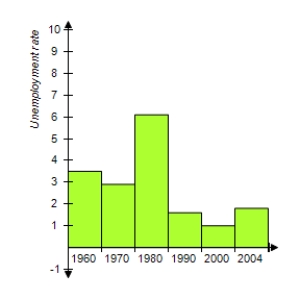
B) 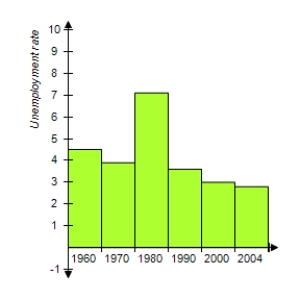
C) 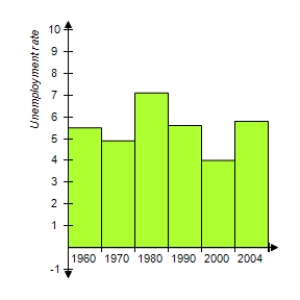
D) 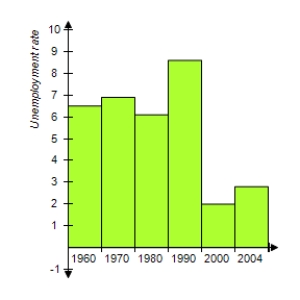
E) 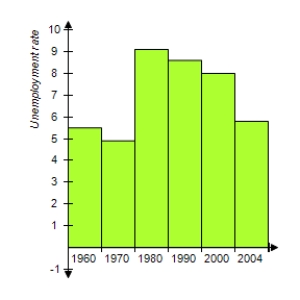
Correct Answer:

Verified
Correct Answer:
Verified
Related Questions
Q101: A candidate claims that 60% of the
Q102: Suppose a population of scores x is
Q103: A quiz consists of 10 multiple-choice questions
Q104: Which frequency table best describes the data
Q105: Find the mode of the following data.
Q107: If a fair die is rolled 7
Q108: If the probability of success on each
Q109: Which list of data is displayed in
Q110: If a die is rolled 113 times,
Q111: The table below gives the votes in