Multiple Choice
The following bar graph shows the size of the average farm (in acres) for selected years from 1940 to 2000. Which table shows the data displayed in the graph? 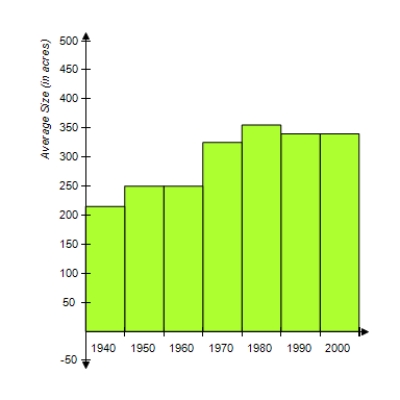
A) 
B) 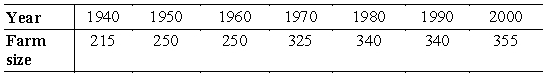
C) 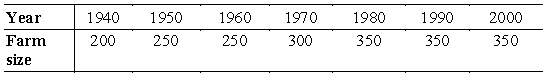
D) 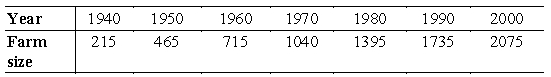
E) 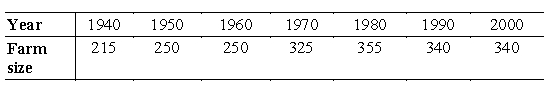
Correct Answer:

Verified
Correct Answer:
Verified
Related Questions
Q27: Find the median of the set of
Q28: Suppose a population of scores x is
Q29: Suppose according to one of Mendel's hybridization
Q30: If a die is rolled 39 times,
Q31: The following table defines a discrete probability
Q33: A nonprofit organization sells chances for a
Q34: A baseball player has a lifetime batting
Q35: Use a table of the standard normal
Q36: The mean weight of a group of
Q37: A new car with a $19,700 list