Multiple Choice
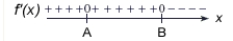
Use the sign diagram for  to determine x-values at which relative maxima occur, where
  and
and  .
. 
A) 
B) 
C) 
And 
D) 
E) no relative maxima
Correct Answer:

Verified
Correct Answer:
Verified
Q151: A graph of <img src="https://d2lvgg3v3hfg70.cloudfront.net/TB1243/.jpg" alt="A graph
Q152: A function and its graph are given.
Q153: Use the sign diagram for <img src="https://d2lvgg3v3hfg70.cloudfront.net/TB1243/.jpg"
Q154: For the given function, find all intervals
Q155: A function and its first and second
Q157: A function and its graph are given.
Q158: The profit from a grove of orange
Q159: Use the sign diagram for <img src="https://d2lvgg3v3hfg70.cloudfront.net/TB1243/.jpg"
Q160: The percent <img src="https://d2lvgg3v3hfg70.cloudfront.net/TB1243/.jpg" alt="The percent
Q161: A function and its graph are given.