Multiple Choice
The following figure shows the growth of a population as a function of time. 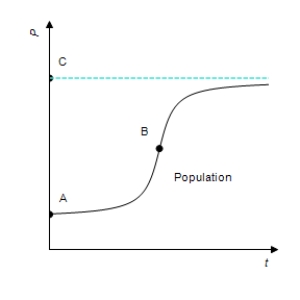 Which of A, B, and C correspond(s) to the point(s) at which the growth rate attains its maximum?
A) B
B) A
C) C
D) A and C
E) none of the above
Correct Answer:

Verified
Correct Answer:
Verified
Related Questions
Q82: For the given function find the relative
Q83: A function and its first and second
Q84: Find all vertical asymptotes for the given
Q85: Make a sign diagram for the function
Q86: Suppose the average costs of a mining
Q88: Suppose that a company needs 800 items
Q89: Suppose that the oxygen level P (for
Q90: For the given function, use the graph
Q91: Analytically determine the location(s) of any horizontal
Q92: A time study showed that, on average,