Multiple Choice
The following figure shows the growth of a population as a function of time. 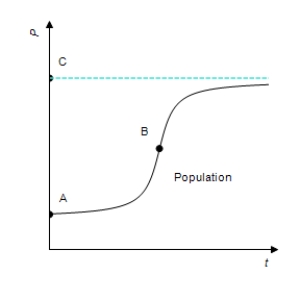 Which of A, B, and/or C correspond(s) to the upper limit of population?
A) B
B) C
C) A
D) B and A
E) none of the above
Correct Answer:

Verified
Correct Answer:
Verified
Related Questions
Q17: The millions of worldwide cellular subscribers can
Q18: A function and its first and second
Q19: The percent p of impurities that can
Q20: For the given function, find all intervals
Q21: A function and its graph are given.
Q23: A function and its graph are given.
Q24: A function and its first and second
Q25: Suppose that a chain of auto service
Q26: For the given function, find intervals of
Q27: A function and its graph are given.