Multiple Choice
The graph shows a total cost function. Determine the level of production at which average cost is minimized. 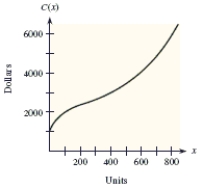
A) 200 units
B) 800 units
C) 400 units
D) 0 units
E) 600 units
Correct Answer:

Verified
Correct Answer:
Verified
Related Questions
Q119: Find any horizontal asymptotes for the given
Q120: A rectangular area is to be enclosed
Q121: Find all points of inflection of the
Q122: An entrepreneur starts new companies and sells
Q123: Suppose the average costs of a mining
Q125: A graph of <img src="https://d2lvgg3v3hfg70.cloudfront.net/TB1243/.jpg" alt="A graph
Q126: A function and its graph are given.
Q127: For the given function and graph, determine
Q128: A box with an open top and
Q129: Suppose that the total number of units