Multiple Choice
The following figure shows the graph of revenue function  and cost function
  . At which of the four
  -values shown is the profit largest?
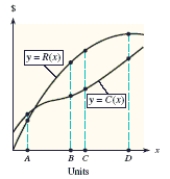
A) B
B) C
C) D
D) A
E) Profit is largest at more than one x-value.
Correct Answer:

Verified
Correct Answer:
Verified
Q143: In this problem, <img src="https://d2lvgg3v3hfg70.cloudfront.net/TB1243/.jpg" alt="In this
Q144: For the given function, find the critical
Q145: For the revenue function given by <img
Q146: For the revenue function given by <img
Q147: Find any vertical asymptotes for the given
Q149: From a tract of land, a developer
Q150: A firm can produce 100 units per
Q151: A graph of <img src="https://d2lvgg3v3hfg70.cloudfront.net/TB1243/.jpg" alt="A graph
Q152: A function and its graph are given.
Q153: Use the sign diagram for <img src="https://d2lvgg3v3hfg70.cloudfront.net/TB1243/.jpg"