Multiple Choice
The following table shows the rate of oil consumption (in thousands of barrels per year) by a certain city. Estimate the total consumption of oil by the city from 1999 -2004 by using 5 equal subdivisions and left-hand endpoints to estimate the area under the graph that corresponds to the table from 1999 to 2004. 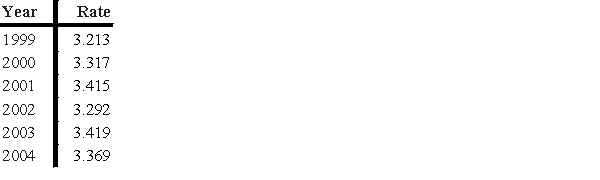
A) 17.708 thousand barrels
B) 16.656 thousand barrels
C) 16.812 thousand barrels
D) 17.606 thousand barrels
E) 15.733 thousand barrels
Correct Answer:

Verified
Correct Answer:
Verified
Q7: Find the producer's surplus for a product
Q8: Evaluate the integral <img src="https://d2lvgg3v3hfg70.cloudfront.net/TB1243/.jpg" alt="Evaluate the
Q9: Use Simpson's Rule to approximate <img src="https://d2lvgg3v3hfg70.cloudfront.net/TB1243/.jpg"
Q10: Assume that a store finds that its
Q11: Find the area of the region enclosed
Q13: A franchise models the profit from its
Q14: Find the value of the given sum
Q15: Evaluate the integral <img src="https://d2lvgg3v3hfg70.cloudfront.net/TB1243/.jpg" alt="Evaluate the
Q16: Suppose that a printing firm considers the
Q17: Use integration by parts to evaluate <img