Multiple Choice
The following table shows the median age of automobiles and trucks on the road for a certain country. Use linear regression to find the linear equation that is the best fit for the data, with x equal to the number of years past 1980. 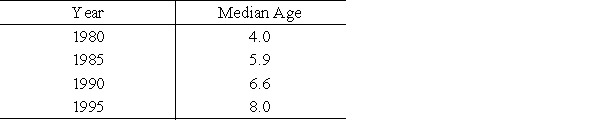
A) 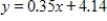
B) 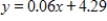
C) 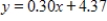
D) 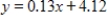
E) 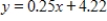
Correct Answer:

Verified
Correct Answer:
Verified
Q42: Test for relative maximum and minimum.
Q43: Give the domain of the function <img
Q44: Find the minimum value of <img src="https://d2lvgg3v3hfg70.cloudfront.net/TB1243/.jpg"
Q45: Find the minimum value of <img src="https://d2lvgg3v3hfg70.cloudfront.net/TB1243/.jpg"
Q46: Suppose that the joint cost function for
Q48: Give the domain of the function <img
Q49: Suppose that the number of thousands of
Q50: The total cost (in dollars) of producing
Q51: The future value S of an investment
Q52: The demand functions for <img src="https://d2lvgg3v3hfg70.cloudfront.net/TB1243/.jpg" alt="The