Multiple Choice
The following table gives the actual or projected population in millions for a certain city for selected years from 2000 to 2050. Use linear regression to find the linear equation that is the best fit for the data, with x equal to the number of years past 2000. 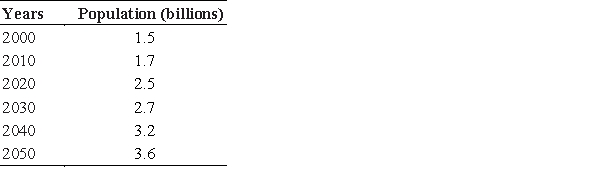
A) 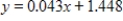
B) 
C) 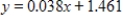
D) 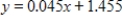
E) 
Correct Answer:

Verified
Correct Answer:
Verified
Q72: If <img src="https://d2lvgg3v3hfg70.cloudfront.net/TB1243/.jpg" alt="If ,
Q73: Suppose that the number of units of
Q74: A company manufactures two products, A and
Q75: If <img src="https://d2lvgg3v3hfg70.cloudfront.net/TB1243/.jpg" alt="If ,
Q76: On the basis of past experience, a
Q78: If <img src="https://d2lvgg3v3hfg70.cloudfront.net/TB1243/.jpg" alt="If ,
Q79: If <img src="https://d2lvgg3v3hfg70.cloudfront.net/TB1243/.jpg" alt="If ,
Q80: Test for relative maximum and minimum.
Q81: Find x and y such that <img
Q82: Suppose that the profit from the sale