Multiple Choice
College students were surveyed to determine how much they planned to spend in various categories during the upcoming academic year. One category is the amount spent on school supplies. The graphs below show the amount of money spent on school supplies by women and men. 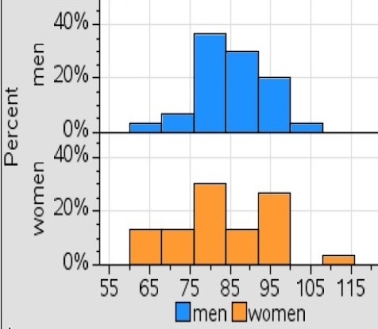 Approximately what percent of women spend more than $105 on school supplies?
A) 5%
B) 10%
C) 15%
D) 20%
Correct Answer:

Verified
Correct Answer:
Verified
Q35: When the conclusions based upon the aggregated
Q58: To construct a pie chart using Excel's
Q59: You are given the following data
Q60: A graphical method that can be used
Q61: The height and weight are recorded by
Q62: What type of relationship is depicted in
Q64: You are given the following data
Q65: Excel's Chart Tools can be used to
Q67: The minimum number of variables represented in
Q68: A researcher asked 20 people for their