Multiple Choice
We ask 30 people the following question: "How many people do you live with?" Below are the results in a dot plot. 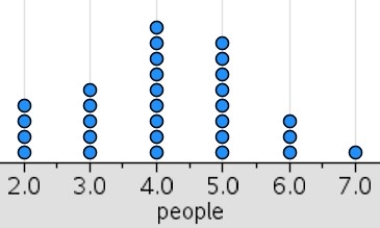 What percentage of people surveyed live with 3 or less people?
A) 30%
B) 40%
C) 50%
D) 90%
Correct Answer:

Verified
Correct Answer:
Verified
Related Questions
Q17: The difference between the lower class limits
Q19: A frequency distribution is a _.<br>A) tabular
Q19: The sum of frequencies for all classes
Q20: The following is a summary of
Q21: Excel's Chart Tools does NOT have a
Q22: In Excel, the line of best fit
Q25: A graphical device for depicting categorical data
Q26: A graphical device for presenting categorical data
Q27: The minimum number of variables represented in
Q28: A researcher is gathering data from four