Multiple Choice
Use the figure for the question(s) below.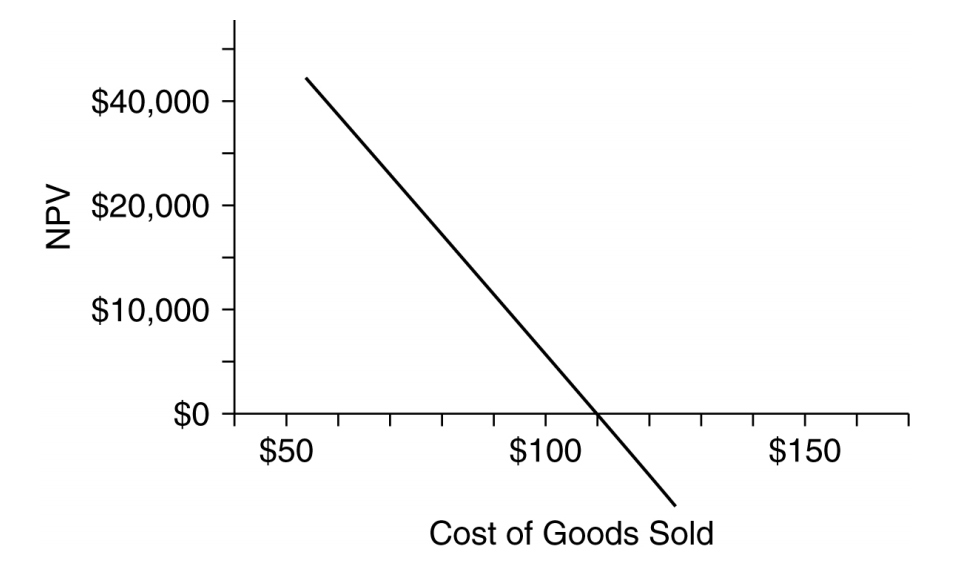
-The graph above shows the break-even analysis for the cost of making a certain good. Based on this chart, which of the following is true?
A) The net present value (NPV) of the project increases with increased cost of goods sold.
B) The net present value (NPV) of the project will be positive if the cost of good sold is greater than $110.
C) If the good costs $110 to make, the net present value (NPV) of the project will be zero.
D) The project should not be undertaken if the predicted cost of goods sold is less than $110.
Correct Answer:

Verified
Correct Answer:
Verified
Q58: Which of the following best defines incremental
Q59: Cameron Industries is purchasing a new chemical
Q60: Use the information for the question(s)
Q61: How does the capital budgeting process begin?<br>A)
Q64: Which of the following would you NOT
Q65: When evaluating the effectiveness of an improved
Q65: Which of the following best explains why
Q66: A firm is considering changing their credit
Q67: Which of the following best describes why
Q68: An exploration of the effect of changing