Essay
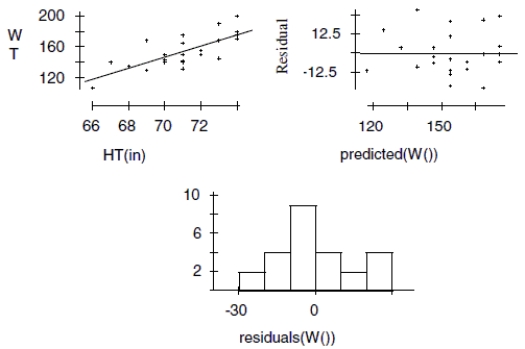
Height and weight Last fall, as our first example of correlation, we looked at the heights and weights of some AP* Statistics students. Here are the scatterplot, the residuals plot, a histogram of the residuals, and the regression analysis for the data we collected from the males. Use this information to analyze the association between heights and weights of teenage boys.
Dependent variable is:WT(lb)
squared
a. Is there an association? Write appropriate hypotheses. b. Are the assumptions for regression satisfied? Explain. c. What do you conclude?
d. Create a 95% confidence interval for the true slope.
e. Explain in context what your interval means.
Correct Answer:

Verified
a.  : There is no association between he...
View Answer
Unlock this answer now
Get Access to more Verified Answers free of charge
Correct Answer:
Verified
View Answer
Unlock this answer now
Get Access to more Verified Answers free of charge
Q27: For the scenario described below, simply name
Q28: Height and weight Is the height
Q29: Suppose you were asked to analyze
Q30: The vast majority of states and
Q31: Suppose that after the study described in
Q33: Suppose you were asked to analyze
Q34: Of the 23 first year male
Q35: In the study "The Role of
Q36: Carnivores A random sample of some
Q37: Car colors According to Ward's Communication, 19%