Essay
The following is a scatterplot of the average final exam score versus midterm score for 11 sections of an introductory statistics class: 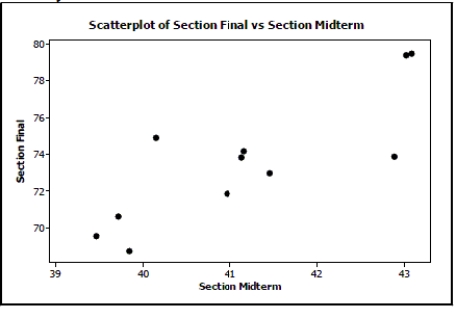
The correlation coefficient for these data is r = 0.829. If you had a scatterplot of the final exam score versus midterm score for all individual students in this introductory statistics course, would the correlation coefficient be weaker, stronger, or about the same? Explain.
Correct Answer:

Verified
Relationships based on averages have hig...View Answer
Unlock this answer now
Get Access to more Verified Answers free of charge
Correct Answer:
Verified
View Answer
Unlock this answer now
Get Access to more Verified Answers free of charge
Q5: Interpret the intercept of your model in
Q12: Interpret the slope of your model in
Q65: A plot of the residuals versus the
Q67: This regression analysis examines the relationship
Q68: A residual plot that has no pattern
Q69: On the axes below, sketch a scatterplot
Q71: Penicillin Doctors studying how the human
Q72: A silly psychology student gathers data on
Q73: The correlation between a family's weekly income
Q75: The bigger the stop sign, the more