Essay
Crawling Researchers at the University of Denver Infant Study Center investigated whether babies take longer to learn to crawl in cold months (when they are often bundled in clothes that restrict their movement) than in warmer months. The study sought an association between babies' first crawling age (in weeks) and the average temperature during the month they first try to crawl (about 6 months after birth). Between 1988 and
1991 parents reported the birth month and age at which their child was first able to creep
or crawl a distance of four feet in one minute. Data were collected on 208 boys and 206 girls. The graph below plots average crawling ages (in weeks) against the mean temperatures when the babies were 6 months old. The researchers found a correlation of r
= -0.70 and the their line of best fit was
= 36 - 0.08AvTemp. 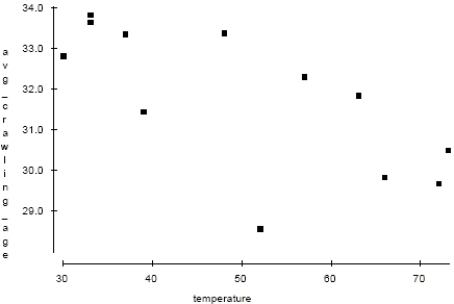
a. Draw the line of best fit on the graph. (Show your method clearly.)
b. Describe the association in context.
c. Explain (in context) what the slope of the line means.
d. Explain (in context) what the y-intercept of the line means. e. Explain (in context) what means.
f. In this context, what does a negative residual indicate?
Correct Answer:

Verified
a. Plot 2 points; for example (30, 33.6)...View Answer
Unlock this answer now
Get Access to more Verified Answers free of charge
Correct Answer:
Verified
View Answer
Unlock this answer now
Get Access to more Verified Answers free of charge
Q128: Which scatterplot shows a strong association between
Q129: A medical researcher finds that the more
Q130: <b>Gas mileage</b> An important factor in
Q131: A study examined the number of
Q132: In an effort to decide if
Q134: A researcher studied the relationship between
Q135: <b>Car commercials</b> A car dealer investigated the
Q136: Baseball coaches use a radar gun to
Q137: Baseball coaches use a radar gun to
Q138: The correlation coefficient between high school grade