Essay
Here is a scatterplot of weight versus height for students in an introductory statistics class.The men are coded as '1' and appear as circles in the scatterplot; the women are coded as '2' and appear as squares in the scatterplot. 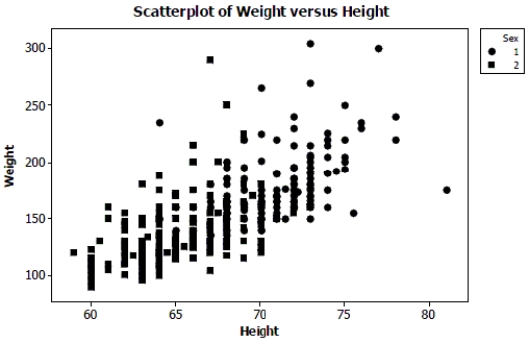
a. Do you think there is a clear pattern? Describe the association between weight and height.
b. Comment on any differences you see between men and women in the plot.
c. Do you think a linear model from the set of all data could accurately predict the weight of a student with height 70 inches? Explain.
Correct Answer:

Verified
a. There is a moderately strong, positiv...View Answer
Unlock this answer now
Get Access to more Verified Answers free of charge
Correct Answer:
Verified
View Answer
Unlock this answer now
Get Access to more Verified Answers free of charge
Q12: Interpret the slope of your model in
Q72: A silly psychology student gathers data on
Q73: The correlation between a family's weekly income
Q75: The bigger the stop sign, the more
Q76: All but one of these statements contain
Q78: The bigger the stop sign, the
Q79: An article in the Journal of
Q80: Height and weight Suppose that both height
Q81: Earning power A college's job placement office
Q82: The bigger the stop sign, the