Essay
The side-by-side boxplots show the cumulative college GPAs for sophomores, juniors, and seniors taking an intro stats course in Autumn 2003. 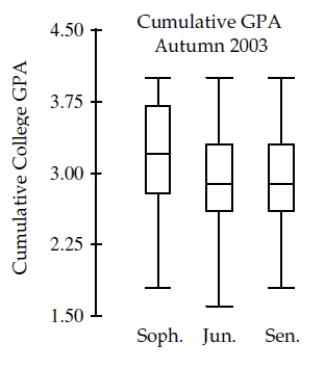
a. Which class (sophomore, junior, or senior) had the lowest cumulative college GPA? What is the approximate value of that GPA?
b. Which class had the highest median GPA, and what is that GPA?
c. Which class had the largest range for GPA, and what is it?
d. Which class had the most symmetric set of GPAs? The most skewed set of GPAs?
Correct Answer:

Verified
a. The junior class had the lowest cumul...View Answer
Unlock this answer now
Get Access to more Verified Answers free of charge
Correct Answer:
Verified
View Answer
Unlock this answer now
Get Access to more Verified Answers free of charge
Q3: On Monday, a class of students took
Q4: In order to plan transportation and
Q5: Which of these variables is most likely
Q6: Suppose that a Normal model describes the
Q7: There are 18 roller coasters in
Q9: If we want to discuss any gaps
Q10: In June 2003 Consumer Reports published an
Q11: The United States Census collects data on
Q12: Nickels minted in the United States are
Q13: Students taking an intro stats class