Multiple Choice
Which is true of the data shown in the histogram?
I. The distribution is skewed to the right.
II. The mean is probably smaller than the median.
III. We should use median and IQR to summarize these data. 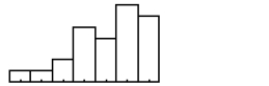
A) II and III only
B) I, II, and III
C) I only
D) II only
E) III only
Correct Answer:

Verified
Correct Answer:
Verified
Related Questions
Q57: Which of these variables is most likely
Q58: The ages of people attending the opening
Q59: Cats and dogs The table shows
Q60: Which of the following summaries are changed
Q61: The advantage of making a stem-and-leaf display
Q63: The boxplots show the age of people
Q64: Write a sentence or two about the
Q65: Has the percentage of young girls
Q66: Auto insurance The Insurance Institute for
Q67: Which of these variables is most likely