Multiple Choice
Which of the following figures illustrates best the sequence of the free-energy values (shown with the star) for a chemical reaction at equilibrium to the removal of products, followed by the response of the equilibrium to this stress?
A) 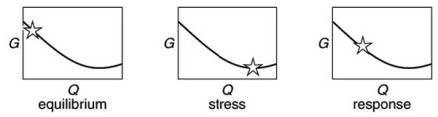
B) 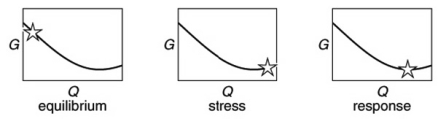
C) 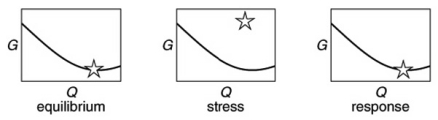
D) 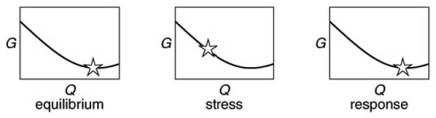
Correct Answer:

Verified
Correct Answer:
Verified
Q94: What is a microstate and how are
Q101: During a spontaneous chemical reaction, it
Q102: Determine <span class="ql-formula" data-value="\Delta"><span class="katex"><span
Q103: The prediction of linearity in a
Q104: What is the value of the
Q105: Suppose <span class="ql-formula" data-value="\Delta"><span class="katex"><span
Q107: Which of the processes A-D will lead
Q109: Which of the following processes are spontaneous?<br>I.Iron
Q110: What is the overall standard free-energy
Q122: Which of the following must be true