Multiple Choice
Which graph best describes how the vapor pressure of a solution varies according to Raoult's law as a nonvolatile solute is added to a liquid? The vapor pressure of the solution is plotted on the y-axis, and the mole fraction of solute is plotted on the x-axis. The origin (0, 0) is not necessarily located where the axes cross. 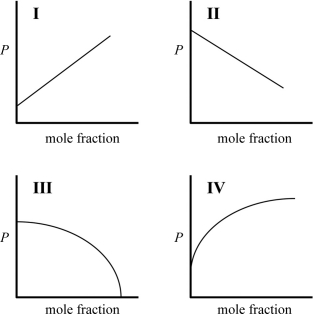
A) I
B) II
C) III
D) IV
Correct Answer:

Verified
Correct Answer:
Verified
Q14: Which one of the ionic compounds below
Q55: Which statement about how the vapor
Q57: Which of the following ranks the compounds
Q58: A physiological saline solution is 0.92% NaCl
Q59: If water contains about 42 mg of
Q61: Describe how the molar mass of a
Q61: Determine the molarity of an aspirin solution
Q63: A 15.0 mg sample of a protein
Q64: What would be the freezing point of
Q90: The term colligative refers to properties that