Multiple Choice
Which graph best describes how the vapor pressure of a solution varies according to Raoult's law as a nonvolatile solute is added to a liquid? The vapor pressure of the solution is plotted on the y-axis, and the mole fraction of solvent is plotted on the x-axis. The origin (0, 0) is not necessarily located where the axes cross. 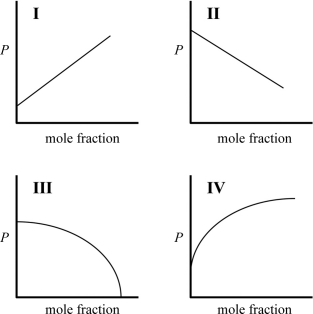
A) I
B) II
C) III
D) IV
Correct Answer:

Verified
Correct Answer:
Verified
Q49: Caryophyllene, a nonelectrolyte, is one of the
Q50: Use the following data to calculate
Q51: You like boiled eggs for breakfast, but
Q52: A solution is made by dissolving 100
Q54: Indicate which aqueous solution has the fastest
Q55: Which statement about how the vapor
Q57: Which of the following ranks the compounds
Q58: Calculate the minimum pressure that must be
Q58: A physiological saline solution is 0.92% NaCl
Q61: Describe how the molar mass of a