Multiple Choice
Which of the following graphs shows the correct relationship between pressure and volume for n moles of gas at temperature T?
A) 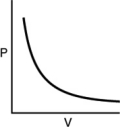
B) 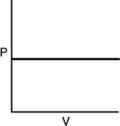
C) 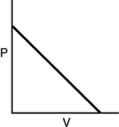
D) 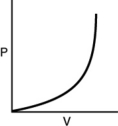
Correct Answer:

Verified
Correct Answer:
Verified
Related Questions
Q25: Explain why the constants a and b
Q68: A 22.4-L sealed chamber at 273 K
Q82: The diffusion rate of H<sub>2</sub> in a
Q96: In terms of the kinetic molecular theory,
Q105: During the decomposition of CaCO<sub>3</sub>(s) into CaO(s)
Q106: Which set of gases is listed from
Q108: What pressure will be measured (in
Q109: What is the pressure in the gas
Q110: Which of the gases shown here will
Q112: Which of the following graphs shows how