Multiple Choice
Which of the following bar charts shows the correct internal energy changes that occur in a pitcher of iced tea (system) , the refrigerator (surroundings) , and the universe, as the iced tea in the refrigerator cools?
A) 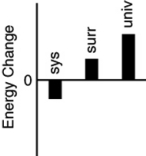
B) 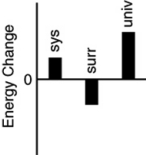
C) 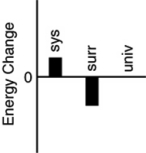
D) 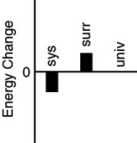
Correct Answer:

Verified
Correct Answer:
Verified
Related Questions
Q53: How much energy is needed to change
Q54: Ammonium nitrate sometimes is used in cold
Q55: Which substance has an enthalpy of formation
Q56: Which statement regarding combustion of a sample
Q57: In a steam engine, steam in a
Q59: In an experiment, 74.3 g of metallic
Q60: Predict the temperature change produced by burning
Q61: According to Coulomb's law, which ionic compound
Q62: For which reaction below does the
Q63: A food sample was burned in a