Multiple Choice
The heating curve for a substance is shown below. The substance initially is a solid. It then becomes a liquid and a gas. Which of the line segments (I-V) represents the solid to liquid phase transition? 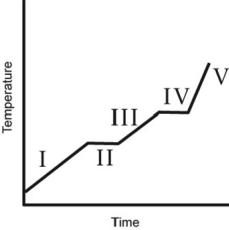
A) I
B) II
C) III
D) IV
E) V
Correct Answer:

Verified
Correct Answer:
Verified
Related Questions
Q64: The best definition of the enthalpy change
Q89: Energy that an object has by virtue
Q100: The following diagrams illustrate the flow of
Q102: A 300 kg black bear hibernates
Q104: The basal metabolic rate (BMR) is the
Q107: C<sub>8</sub>H<sub>18</sub> (114 g/mol, d = 0.69 g/mL)
Q108: The cooling system in an automobile holds
Q109: Which statement A-D about the first
Q114: Which of the following substances will release
Q117: Which one of the following statements is