Multiple Choice
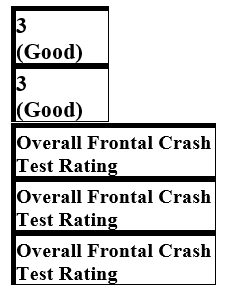
The table shows crashworthiness ratings for several categories of motor vehicles. Take X as the crash-test rating of a small car, Y as the crash-test rating for a small SUV, and so on, as shown in the table. Compute .
A)
B)
C)
D)
E)
Correct Answer:

Verified
Correct Answer:
Verified
Related Questions
Q110: Compute the (sample) variance and the
Q111: Give a sample of 9 scores with
Q112: Give a sample of 8 scores with
Q113: If we model after-tax household income
Q114: Find the value of the probability
Q116: 11 darts are thrown at a
Q117: Find the expected value of a
Q118: A random variable has the probability
Q119: Assume that on a standardized test of
Q120: Given the data.