Multiple Choice
The following diagram shows the movement of U.S. households among three income groups - affluent, middle class, and poor - over the 11-year period 1982-1993. Assuming that the trend shown was to continue, what percent of households classified as affluent in 1982 were predicted to become poor in 2004 (Give your answer to the nearest .) According to the model, what percentage of all U.S. households will be in each income bracket in the long term (Give your answer to the nearest percent.) 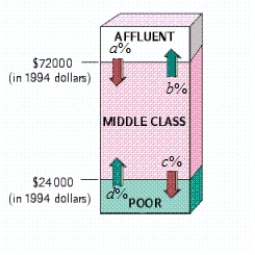 , , ,
, , ,
A) 0.3% of households classified as affluent in 1982 were predicted to become poor in 2004. In the long term: Affluent: 22.7%; Middle class: 36.3%; Poor: 41.1%
B) 0% of households classified as affluent in 1982 were predicted to become poor in 2004.
In the long term: Affluent: 26.5%; Middle class: 8.1%; Poor: 65.4%
C) 0% of households classified as affluent in 1982 were predicted to become poor in 2004.
In the long term: Affluent: 18.9%; Middle class: 64.4%; Poor: 16.7%
D) 0.3% of households classified as affluent in 1982 were predicted to become poor in 2004.
In the long term: Affluent: 26.5%; Middle class: 8.1% ; Poor: 65.4%
E) 2.1% of households classified as affluent in 1982 were predicted to become poor in 2004.
In the long term: Affluent: 26.5%; Middle class: 8.1%; Poor: 65.4%
Correct Answer:

Verified
Correct Answer:
Verified
Q110: In the New York State daily lottery
Q111: A pocket of gummy candy contains 5
Q112: According to a University of Maryland study
Q113: The following table shows hypothetical U.S.
Q114: Use the given transition matrix P
Q116: Any athlete who fails the Enormous State
Q117: Student admissions are based on the
Q118: The table below shows the frequency
Q119: Seven coins are tossed. What is the
Q120: A bag contains 4 red marbles,