Multiple Choice
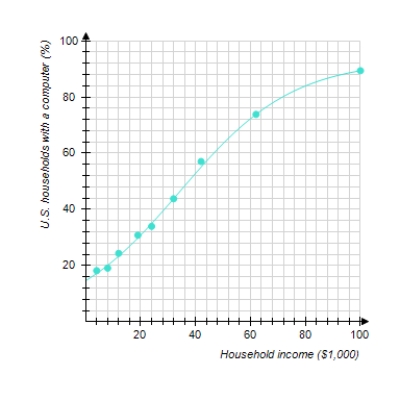
The graph shows the actual percentage of U.S. households with a computer as a function of household income (the data points) and a logistic model of these data (the curve) . The logistic model is
Where x is the household income in thousands of dollars. According to the model, what percentage of extremely wealthy households had computers
A) is close to .
B) is close to .
C) is close to .
D) is close to .
E) is close to .
Correct Answer:

Verified
Correct Answer:
Verified
Q10: You are trying to determine the half-life
Q11: You have just opened a new
Q12: Use logarithms to solve the equation.
Q13: Find the logistic function f with
Q14: Find the y-intercept(s) of the graph
Q16: Find the vertex of the graph
Q17: Pack-Em-In Real Estate is building a new
Q18: The given table corresponds to the
Q19: Last year's epidemic of Martian flu
Q20: Which of the following five functions