Multiple Choice
The chart shows the number of research articles in the prominent journal Physics Review that were written by researchers in Europe during 1983 - 2003 ( represents 1983) . 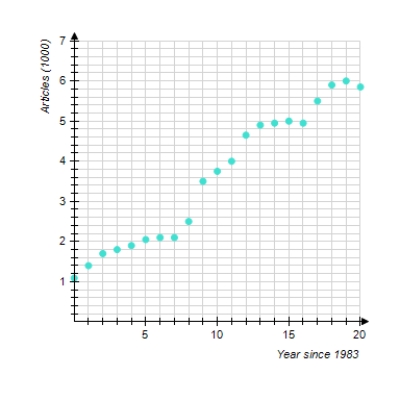
Which of the following logistic functions best models the data ( t is the number of years since 1983.) Try to determine the correct model without actually computing data points.
A)
B)
C)
D)
According to the model you selected, at what percentage was the number of articles growing around 1984
__________%
Correct Answer:

Verified
Correct Answer:
Verified
Q65: Choose the logistic function that best
Q66: For the following demand equation, find
Q67: For the following demand equation, find
Q68: The chart shows the number of
Q69: Convert the exponential function to the
Q71: Model the data using an exponential
Q72: The table is filled correctly.
Q73: In Russia the average consumer drank two
Q74: How long, to the nearest year,
Q75: Choose the correct letter for each